使用 t-SNE 可视化嵌入#
概述#
本教程演示如何使用 Gemini API 中的嵌入来可视化和执行聚类。您将使用t-SNE可视化 20 个新闻组数据集的子集,并使用KMeans算法对该子集进行聚类。
有关开始使用 Gemini API 生成的嵌入的更多信息,请查看Python 快速入门。
前提条件#
您可以在 Google Colab 中运行此快速入门。
要在您自己的开发环境中完成本快速入门,请确保您的环境满足以下要求:
Python 3.9+
安装 jupyter 以运行笔记本
安装#
首先,下载并安装 Gemini API Python 库。
#!pip install -q google.generativeai

## !pip install -U -q google.colab
import re
import tqdm
import numpy as np
import pandas as pd
import matplotlib.pyplot as plt
import seaborn as sns

import google.generativeai as genai
import google.ai.generativelanguage as glm

# Used to securely store your API key
# from google.colab import userdata

from sklearn.datasets import fetch_20newsgroups
from sklearn.manifold import TSNE
from sklearn.cluster import KMeans
from sklearn.metrics import confusion_matrix, ConfusionMatrixDisplay
获取 API 密钥#
在使用 Gemini API 之前,您必须先获取 API 密钥。如果您还没有密钥,请在 Google AI Studio 中一键创建密钥。
在 Colab 中,将密钥添加到左侧面板“🔑”下的秘密管理器中。将其命名为 API_KEY。 获得 API 密钥后,将其传递给 SDK。您可以通过两种方式执行此操作:
将密钥放入 GOOGLE_API_KEY 环境变量中(SDK 将自动从那里获取它)。
将密钥传递给 genai.configure(api_key=…)
# Or use `os.getenv('API_KEY')` to fetch an environment variable.
# API_KEY=userdata.get('API_KEY')
GOOGLE_API_KEY = "YOUR-API-KEY"
genai.configure(api_key=GOOGLE_API_KEY)
Tip
要点:接下来,您将选择一个模型。任何嵌入模型都适用于本教程,但对于实际应用程序,选择特定模型并坚持使用非常重要。不同型号的输出互不兼容。
Warning
注意:目前,Gemini API 仅在某些区域可用。
for m in genai.list_models():
  if 'embedContent' in m.supported_generation_methods:
    print(m.name)
models/embedding-001
数据集#
20 个新闻组文本数据集包含 20 个主题的 18,000 个新闻组帖子,分为训练集和测试集。训练和测试数据集之间的划分基于特定日期之前和之后发布的消息。在本教程中,您将使用训练子集。
newsgroups_train = fetch_20newsgroups(subset='train')

# View list of class names for dataset
newsgroups_train.target_names
['alt.atheism',
 'comp.graphics',
 'comp.os.ms-windows.misc',
 'comp.sys.ibm.pc.hardware',
 'comp.sys.mac.hardware',
 'comp.windows.x',
 'misc.forsale',
 'rec.autos',
 'rec.motorcycles',
 'rec.sport.baseball',
 'rec.sport.hockey',
 'sci.crypt',
 'sci.electronics',
 'sci.med',
 'sci.space',
 'soc.religion.christian',
 'talk.politics.guns',
 'talk.politics.mideast',
 'talk.politics.misc',
 'talk.religion.misc']
这是训练集中的第一个示例。
idx = newsgroups_train.data[0].index('Lines')
print(newsgroups_train.data[0][idx:])
Lines: 15

 I was wondering if anyone out there could enlighten me on this car I saw
the other day. It was a 2-door sports car, looked to be from the late 60s/
early 70s. It was called a Bricklin. The doors were really small. In addition,
the front bumper was separate from the rest of the body. This is
all I know. If anyone can tellme a model name, engine specs, years
of production, where this car is made, history, or whatever info you
have on this funky looking car, please e-mail.

Thanks,
- IL
   ---- brought to you by your neighborhood Lerxst ----
# Apply functions to remove names, emails, and extraneous words from data points in newsgroups.data
newsgroups_train.data = [re.sub(r'[\w\.-]+@[\w\.-]+', '', d) for d in newsgroups_train.data] # Remove email
newsgroups_train.data = [re.sub(r"\([^()]*\)", "", d) for d in newsgroups_train.data] # Remove names
newsgroups_train.data = [d.replace("From: ", "") for d in newsgroups_train.data] # Remove "From: "
newsgroups_train.data = [d.replace("\nSubject: ", "") for d in newsgroups_train.data] # Remove "\nSubject: "
# Put training points into a dataframe
df_train = pd.DataFrame(newsgroups_train.data, columns=['Text'])
df_train['Label'] = newsgroups_train.target
# Match label to target name index
df_train['Class Name'] = df_train['Label'].map(newsgroups_train.target_names.__getitem__)
# Retain text samples that can be used in the gecko model.
df_train = df_train[df_train['Text'].str.len() < 10000]

df_train
| Text | Label | Class Name | |
|---|---|---|---|
| 0 | WHAT car is this!?\nNntp-Posting-Host: rac3.w... | 7 | rec.autos |
| 1 | SI Clock Poll - Final Call\nSummary: Final ca... | 4 | comp.sys.mac.hardware |
| 2 | PB questions...\nOrganization: Purdue Univers... | 4 | comp.sys.mac.hardware |
| 3 | Re: Weitek P9000 ?\nOrganization: Harris Comp... | 1 | comp.graphics |
| 4 | Re: Shuttle Launch Question\nOrganization: Sm... | 14 | sci.space |
| ... | ... | ... | ... |
| 11309 | Re: Migraines and scans\nDistribution: world... | 13 | sci.med |
| 11310 | Screen Death: Mac Plus/512\nLines: 22\nOrganiz... | 4 | comp.sys.mac.hardware |
| 11311 | Mounting CPU Cooler in vertical case\nOrganiz... | 3 | comp.sys.ibm.pc.hardware |
| 11312 | Re: Sphere from 4 points?\nOrganization: Cent... | 1 | comp.graphics |
| 11313 | stolen CBR900RR\nOrganization: California Ins... | 8 | rec.motorcycles |
11141 rows × 3 columns
接下来,您将通过在训练数据集中获取 100 个数据点并删除一些类别来对一些数据进行采样,以运行本教程。选择要比较的科学类别。
# Take a sample of each label category from df_train
SAMPLE_SIZE = 150
df_train = (df_train.groupby('Label', as_index = False)
                    .apply(lambda x: x.sample(SAMPLE_SIZE))
                    .reset_index(drop=True))

# Choose categories about science
df_train = df_train[df_train['Class Name'].str.contains('sci')]

# Reset the index
df_train = df_train.reset_index()
df_train
| index | Text | Label | Class Name | |
|---|---|---|---|---|
| 0 | 1650 | Re: 80-bit keyseach machine\nOrganization: Ad... | 11 | sci.crypt |
| 1 | 1651 | reason for Clipper alg'm secrecy\nReply-To: ... | 11 | sci.crypt |
| 2 | 1652 | Re: Do we need the clipper for cheap security... | 11 | sci.crypt |
| 3 | 1653 | Re: Hard drive security for FBI targets\nLine... | 11 | sci.crypt |
| 4 | 1654 | Re: Estimating Wiretap Costs/Benefits\nSummar... | 11 | sci.crypt |
| ... | ... | ... | ... | ... |
| 595 | 2245 | Re: Lindbergh and the moon \nOrganization: Un... | 14 | sci.space |
| 596 | 2246 | Re: Solar Sail Data\nArticle-I.D.: aurora.1993... | 14 | sci.space |
| 597 | 2247 | Re: Boom! Whoosh......\nOrganization: The Do... | 14 | sci.space |
| 598 | 2248 | Re: Why not give $1 billion to first year-lon... | 14 | sci.space |
| 599 | 2249 | Re: Comet in Temporary Orbit Around Jupiter?\... | 14 | sci.space |
600 rows × 4 columns
df_train['Class Name'].value_counts()
Class Name
sci.crypt          150
sci.electronics    150
sci.med            150
sci.space          150
Name: count, dtype: int64
创建嵌入#
在本节中,您将了解如何使用 Gemini API 中的嵌入为数据框中的不同文本生成嵌入。
使用模型 embedding-001 对嵌入进行 API 更改#
对于新的嵌入模型 embedding-001,有一个新的任务类型参数和可选标题(仅在 task_type=RETRIEVAL_DOCUMENT 时有效)。
这些新参数仅适用于最新的嵌入模型。任务类型为:
任务类型 |
描述 |
|---|---|
RETRIEVAL_QUERY |
指定给定文本是搜索/检索设置中的查询。 |
RETRIEVAL_DOCUMENT |
指定给定文本是搜索/检索设置中的文档。 |
SEMANTIC_SIMILARITY |
指定给定文本将用于语义文本相似性 (STS)。 |
CLASSIFICATION |
指定嵌入将用于分类。 |
CLUSTERING |
指定嵌入将用于聚类。 |
from tqdm.auto import tqdm
tqdm.pandas()

from google.api_core import retry

def make_embed_text_fn(model):

  @retry.Retry(timeout=300.0)
  def embed_fn(text: str) -> list[float]:
    # Set the task_type to CLUSTERING.
    embedding = genai.embed_content(model=model,
                                    content=text,
                                    task_type="clustering")
    return embedding["embedding"]

  return embed_fn

def create_embeddings(df):
  model = 'models/embedding-001'
  df['Embeddings'] = df['Text'].progress_apply(make_embed_text_fn(model))
  return df

df_train = create_embeddings(df_train)
100%|██████████| 600/600 [03:37<00:00, 2.76it/s]
降维#
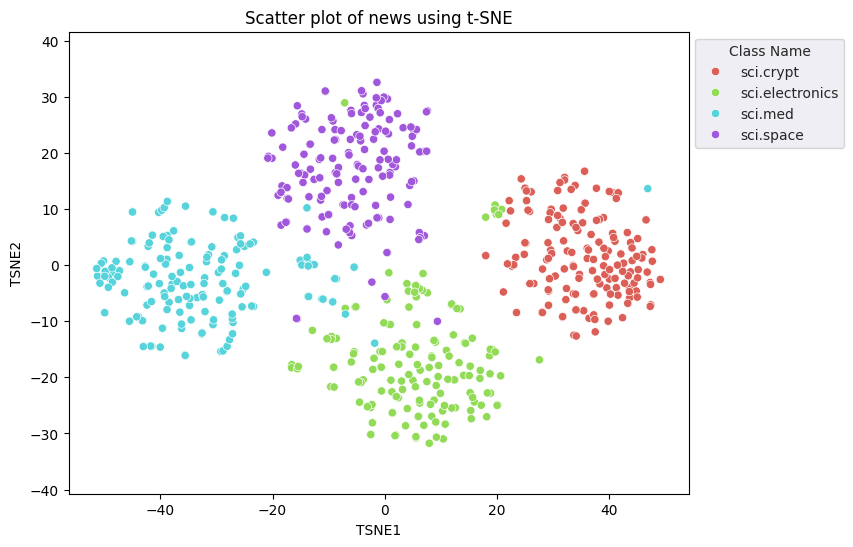
文档嵌入向量的长度为 768。为了可视化嵌入文档如何分组在一起,您将需要应用降维,因为您只能可视化 2D 或 3D 空间中的嵌入。上下文相似的文档在空间上应该更接近,而不是不相似的文档。
len(df_train['Embeddings'][0])
768
# Convert df_train['Embeddings'] Pandas series to a np.array of float32
X = np.array(df_train['Embeddings'].to_list(), dtype=np.float32)
X.shape
(600, 768)
您将应用 t 分布式随机邻域嵌入 (t-SNE) 方法来执行降维。该技术减少了维数,同时保留了簇(靠近的点保持靠近)。对于原始数据,模型尝试构建一个分布,其中其他数据点是“邻居”(例如,它们具有相似的含义)。然后,它优化目标函数以在可视化中保持类似的分布。
tsne = TSNE(random_state=0, n_iter=1000)
tsne_results = tsne.fit_transform(X)
df_tsne = pd.DataFrame(tsne_results, columns=['TSNE1', 'TSNE2'])
df_tsne['Class Name'] = df_train['Class Name'] # Add labels column from df_train to df_tsne
df_tsne
| TSNE1 | TSNE2 | Class Name | |
|---|---|---|---|
| 0 | 30.719217 | 6.754019 | sci.crypt |
| 1 | 42.622414 | 0.371172 | sci.crypt |
| 2 | 43.632767 | -3.970512 | sci.crypt |
| 3 | 25.857092 | 9.590956 | sci.crypt |
| 4 | 30.428589 | -1.919301 | sci.crypt |
| ... | ... | ... | ... |
| 595 | -1.371668 | 32.625580 | sci.space |
| 596 | 1.049393 | 12.153948 | sci.space |
| 597 | -0.349571 | 15.891821 | sci.space |
| 598 | -0.791861 | 27.201237 | sci.space |
| 599 | -18.490322 | 13.022571 | sci.space |
600 rows × 3 columns
fig, ax = plt.subplots(figsize=(8,6)) # Set figsize
sns.set_style('darkgrid', {"grid.color": ".6", "grid.linestyle": ":"})
sns.scatterplot(data=df_tsne, x='TSNE1', y='TSNE2', hue='Class Name', palette='hls')
sns.move_legend(ax, "upper left", bbox_to_anchor=(1, 1))
plt.title('Scatter plot of news using t-SNE');
plt.xlabel('TSNE1');
plt.ylabel('TSNE2');
plt.axis('equal')
(-56.389787673950195, 54.20468330383301, -34.96730289459229, 35.87395343780518)

将结果与 KMeans 进行比较#
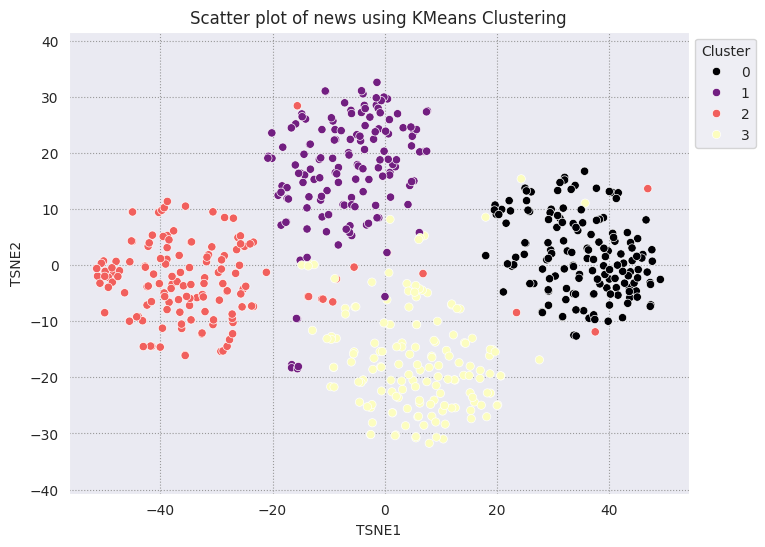
KMeans 聚类是一种流行的聚类算法,经常用于无监督学习。它迭代地确定最佳的 k 个中心点,并将每个示例分配给最近的质心。将嵌入直接输入到 KMeans 算法中,以将嵌入的可视化与机器学习算法的性能进行比较。
# Apply KMeans
kmeans_model = KMeans(n_clusters=4, random_state=1, n_init='auto').fit(X)
labels = kmeans_model.fit_predict(X)
df_tsne['Cluster'] = labels
df_tsne
| TSNE1 | TSNE2 | Class Name | Cluster | |
|---|---|---|---|---|
| 0 | 30.719217 | 6.754019 | sci.crypt | 0 |
| 1 | 42.622414 | 0.371172 | sci.crypt | 0 |
| 2 | 43.632767 | -3.970512 | sci.crypt | 0 |
| 3 | 25.857092 | 9.590956 | sci.crypt | 0 |
| 4 | 30.428589 | -1.919301 | sci.crypt | 0 |
| ... | ... | ... | ... | ... |
| 595 | -1.371668 | 32.625580 | sci.space | 1 |
| 596 | 1.049393 | 12.153948 | sci.space | 1 |
| 597 | -0.349571 | 15.891821 | sci.space | 1 |
| 598 | -0.791861 | 27.201237 | sci.space | 1 |
| 599 | -18.490322 | 13.022571 | sci.space | 1 |
600 rows × 4 columns
fig, ax = plt.subplots(figsize=(8,6)) # Set figsize
sns.set_style('darkgrid', {"grid.color": ".6", "grid.linestyle": ":"})
sns.scatterplot(data=df_tsne, x='TSNE1', y='TSNE2', hue='Cluster', palette='magma')
sns.move_legend(ax, "upper left", bbox_to_anchor=(1, 1))
plt.title('Scatter plot of news using KMeans Clustering');
plt.xlabel('TSNE1');
plt.ylabel('TSNE2');
plt.axis('equal')
(-56.389787673950195, 54.20468330383301, -34.96730289459229, 35.87395343780518)

def get_majority_cluster_per_group(df_tsne_cluster, class_names):
  class_clusters = dict()
  for c in class_names:
    # Get rows of dataframe that are equal to c
    rows = df_tsne_cluster.loc[df_tsne_cluster['Class Name'] == c]
    # Get majority value in Cluster column of the rows selected
    cluster = rows.Cluster.mode().values[0]
    # Populate mapping dictionary
    class_clusters[c] = cluster
  return class_clusters
classes = df_tsne['Class Name'].unique()
class_clusters = get_majority_cluster_per_group(df_tsne, classes)
class_clusters
{'sci.crypt': 0, 'sci.electronics': 3, 'sci.med': 2, 'sci.space': 1}
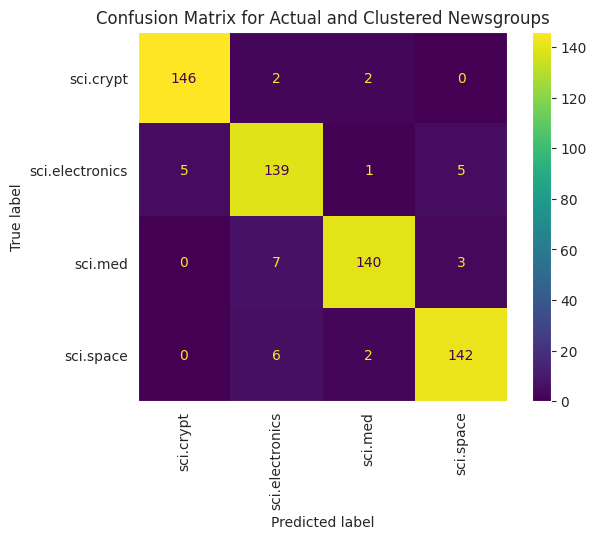
获取每个组的大多数集群,并查看该集群中有多少该组的实际成员。
# Convert the Cluster column to use the class name
class_by_id = {v: k for k, v in class_clusters.items()}
df_tsne['Predicted'] = df_tsne['Cluster'].map(class_by_id.__getitem__)

# Filter to the correctly matched rows
correct = df_tsne[df_tsne['Class Name'] == df_tsne['Predicted']]

# Summarise, as a percentage
acc = correct['Class Name'].value_counts() / SAMPLE_SIZE
acc
Class Name
sci.crypt          0.973333
sci.space          0.946667
sci.med            0.933333
sci.electronics    0.926667
Name: count, dtype: float64
# Get predicted values by name
df_tsne['Predicted'] = ''
for idx, rows in df_tsne.iterrows():
  cluster = rows['Cluster']
  # Get key from mapping based on cluster value
  key = list(class_clusters.keys())[list(class_clusters.values()).index(cluster)]
  df_tsne.at[idx, 'Predicted'] = key

df_tsne
| TSNE1 | TSNE2 | Class Name | Cluster | Predicted | |
|---|---|---|---|---|---|
| 0 | 30.719217 | 6.754019 | sci.crypt | 0 | sci.crypt |
| 1 | 42.622414 | 0.371172 | sci.crypt | 0 | sci.crypt |
| 2 | 43.632767 | -3.970512 | sci.crypt | 0 | sci.crypt |
| 3 | 25.857092 | 9.590956 | sci.crypt | 0 | sci.crypt |
| 4 | 30.428589 | -1.919301 | sci.crypt | 0 | sci.crypt |
| ... | ... | ... | ... | ... | ... |
| 595 | -1.371668 | 32.625580 | sci.space | 1 | sci.space |
| 596 | 1.049393 | 12.153948 | sci.space | 1 | sci.space |
| 597 | -0.349571 | 15.891821 | sci.space | 1 | sci.space |
| 598 | -0.791861 | 27.201237 | sci.space | 1 | sci.space |
| 599 | -18.490322 | 13.022571 | sci.space | 1 | sci.space |
600 rows × 5 columns
为了更好地可视化应用于数据的 KMeans 性能,您可以使用混淆矩阵。混淆矩阵使您能够评估分类模型在准确性之外的性能。您可以看到错误分类的点被分类为哪些内容。您将需要在上面的数据框中收集的实际值和预测值。
cm = confusion_matrix(df_tsne['Class Name'].to_list(), df_tsne['Predicted'].to_list())
disp = ConfusionMatrixDisplay(confusion_matrix=cm,
                              display_labels=classes)
disp.plot(xticks_rotation='vertical')
plt.title('Confusion Matrix for Actual and Clustered Newsgroups');
plt.grid(False)

下一步#
您现在已经通过聚类创建了自己的嵌入可视化!尝试使用您自己的文本数据将它们可视化为嵌入。您可以执行降维以完成可视化步骤。请注意,TSNE 擅长对输入进行聚类,但可能需要较长时间才能收敛,或者可能会陷入局部最小值。如果您遇到此问题,您可以考虑的另一种技术是主成分分析 (PCA)
KMeans 之外还有其他聚类算法,例如基于密度的空间聚类 (DBSCAN)
要了解如何使用 Gemini API 中的其他服务,请访问 Python 快速入门。要了解有关如何使用嵌入的更多信息,请查看可用的示例。要了解如何从头开始创建它们,请参阅 TensorFlow 的词嵌入教程。
